The question
How should a generative planner change both its update direction and its exploration when the feasible region is narrow, disconnected, or posture-dependent?
Demonstrations
Original source timing preserved; 1× playback, looped and silent. Source animation timing is not a planning-latency benchmark.
Original source timing preserved; 1× playback, looped and silent. Source animation timing is not a planning-latency benchmark.
How it works
Read the active geometry
Task context and violation proxies select active constraints. Their normals describe locally important directions for foothold consistency or body clearance.
Shape refinement and exploration
A normal-induced metric shapes the denoising direction, while a regularized tangent filter shapes reverse-process noise. Candidate-sampling randomness and added reverse stochasticity remain distinct.
Schedule the reverse transport
An adaptive task-geometry schedule separates transport choice from stochasticity, accommodating DDPM-, DDIM-, and flow-like updates as exploration gives way to refinement.
Correct and execute
Optional Convex Feasible Set correction addresses residual violations. A reference governor then adapts a selected plan to the tracking limits of the execution controller.
Results
The paper evaluates both the trajectories a planner returns and the references its execution pipeline can follow. These results cover discrete foothold choices and continuous whole-body clearance; planning success and execution success are reported separately.
S2 pSSR: 2GO 88%, MDOC 68%, MD-COAS 14%, MBD 4%, MPPI 20%. Five seeds, ten returned trajectories per seed; goal tolerance 0.20 m.
S1: 98% planning pSSR and 80% governed MuJoCo Go2 eSSR. Execution selects and adapts one reference per seed, across five trials; the two percentages measure different populations.

From diverse samples to contact-consistent routes
Full resolution ↗Original stepping-stone samples at 90%, 50%, and 10% of the reverse process, from left to right. Early samples preserve multiple foothold choices; later samples concentrate onto contact-consistent routes.
Figure 3 · top-right panels · Paper ↗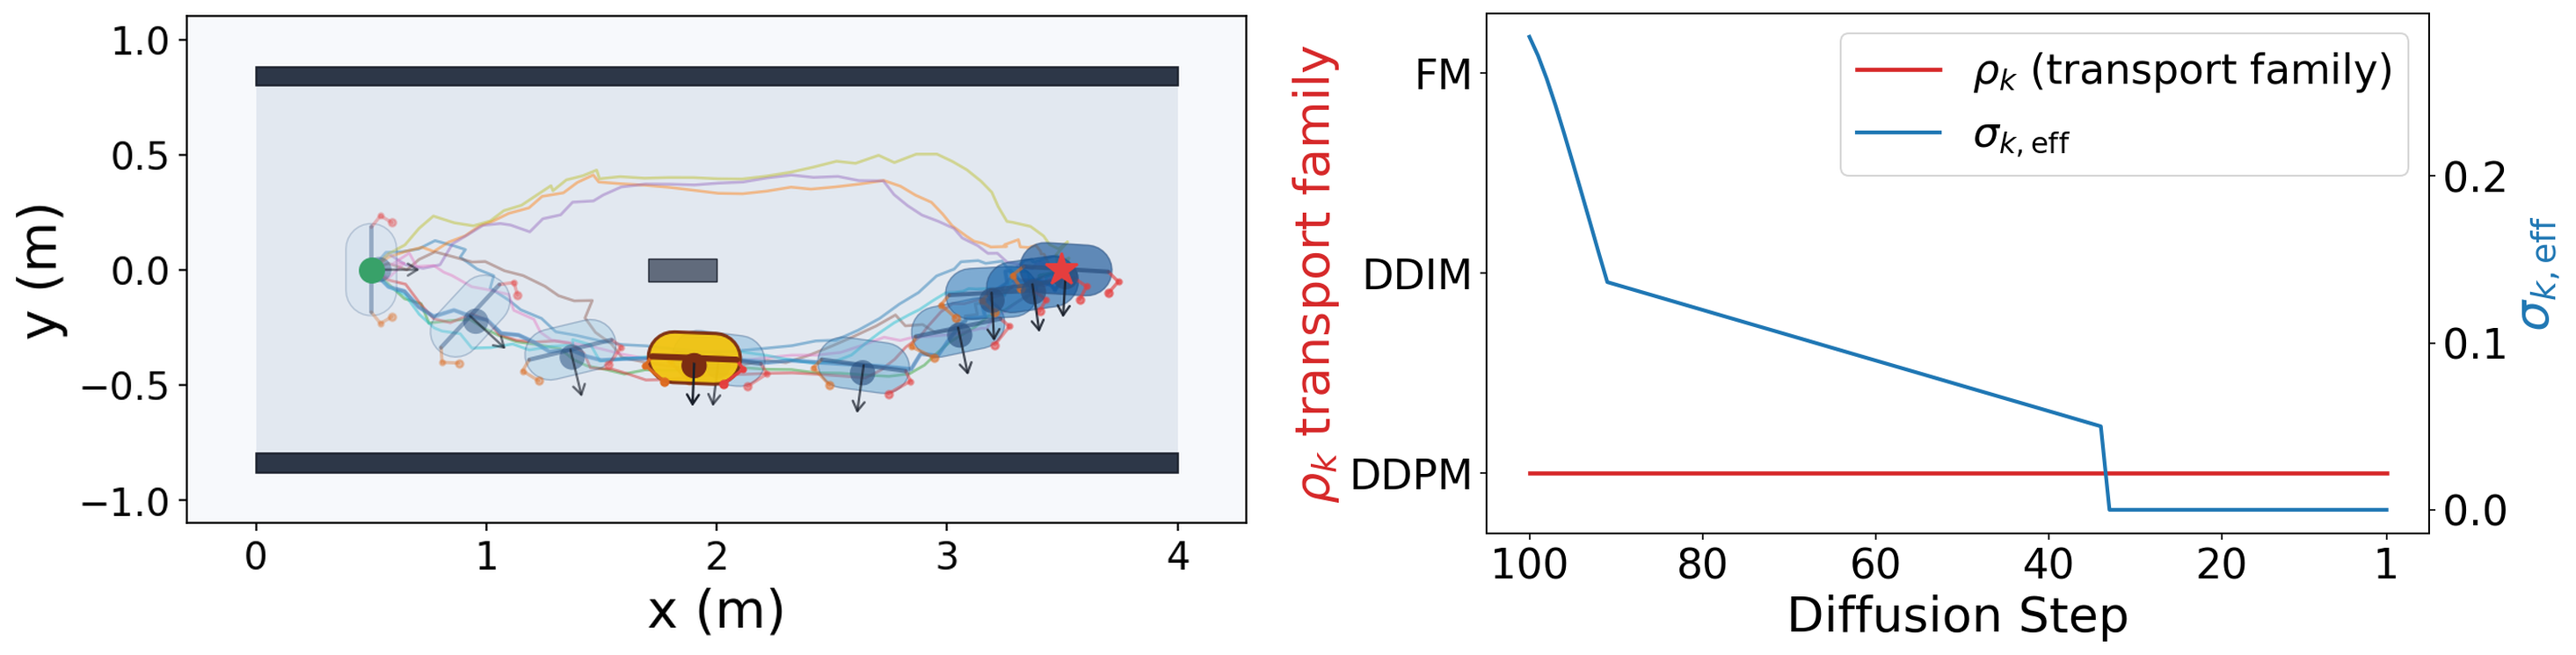
Multimodal routes and adaptive reverse transport
Full resolution ↗Zone A from the corridor benchmark. Planned whole-body latent trajectories preserve side-passing alternatives (left); the adaptive transport family and effective noise evolve within a fixed 100-step reverse process (right). These are planning results, distinct from the execution rates below.
Figure 4 · Zone A, left and middle panels · Paper ↗Stepping-stone planning and execution
Stepping-stone panel of the original main-results table. S2 uses smaller stones and larger gaps than S1.
| Environment | MPPI | MBD | MDOC | MD-COAS | 2GO (ours) | |||||||||||||||
|---|---|---|---|---|---|---|---|---|---|---|---|---|---|---|---|---|---|---|---|---|
| Environment | pSSR ↑ | pV (cm) ↓ | pT (s) ↓ | eSSR ↑ | pSSR ↑ | pV (cm) ↓ | pT (s) ↓ | eSSR ↑ | pSSR ↑ | pV (cm) ↓ | pT (s) ↓ | eSSR ↑ | pSSR ↑ | pV (cm) ↓ | pT (s) ↓ | eSSR ↑ | pSSR ↑ | pV (cm) ↓ | pT (s) ↓ | eSSR ↑ |
| S1 | 0.40 | 2.20 ± 0.14 | 2.87 ± 0.34 | 0.20 | 0.18 | 3.15 ± 0.36 | 17.85 ± 0.75 | 0.60 | 0.88 | 1.00 ± 0.08 | 18.37 ± 0.17 | 0.80 | 0.32 | 0.85 ± 0.22 | 288.22 ± 33.76 | 0.00 | 0.98 | 0.47 ± 0.14 | 21.51 ± 1.01 | 0.80 |
| S2 | 0.20 | 2.75 ± 0.24 | 2.53 ± 0.23 | 0.00 | 0.04 | 3.01 ± 0.30 | 18.35 ± 3.63 | 0.40 | 0.68 | 1.11 ± 0.12 | 19.73 ± 0.33 | 0.20 | 0.14 | 1.45 ± 0.28 | 99.78 ± 42.47 | 0.00 | 0.88 | 0.61 ± 0.25 | 23.19 ± 2.74 | 0.40 |
pSSR and eSSR are success fractions, not percentages. pSSR evaluates returned planning candidates; eSSR evaluates one selected, adapted execution per seed, including failed planning attempts.
Experimental protocol and metric definitions
Five seeds, with ten clean trajectories per seed. pV and pT are mean ± population standard deviation over the five seed-level values.
The main comparison uses a 48 GB NVIDIA RTX A6000 and nine CPU cores. Planning time covers the complete multi-candidate solve and excludes later execution screening, margin calibration, and deployment.
Nominal sampling/update budgets: 512 samples for stepping stones, 1024 for corridors, and 100 optimizer or reverse steps. These counts do not imply equal wall-clock cost.
pV is mean foothold distance in centimeters for the selected planning candidate.
Quadruped eSSR measures the assisted MuJoCo execution model: the common follower constructs gait and footholds and includes supplementary floating-base PD stabilization.
Humanoid corridor planning and execution
Corridor panel of the original main-results table. ZA: center wall; ZB: U-shaped wall; ZC: tapered squeeze; ZD: spherical obstacles.
| Environment | MPPI | MBD | MDOC | MD-COAS | 2GO (ours) | |||||||||||||||
|---|---|---|---|---|---|---|---|---|---|---|---|---|---|---|---|---|---|---|---|---|
| Environment | pSSR ↑ | pV (%) ↓ | pT (s) ↓ | eSSR ↑ | pSSR ↑ | pV (%) ↓ | pT (s) ↓ | eSSR ↑ | pSSR ↑ | pV (%) ↓ | pT (s) ↓ | eSSR ↑ | pSSR ↑ | pV (%) ↓ | pT (s) ↓ | eSSR ↑ | pSSR ↑ | pV (%) ↓ | pT (s) ↓ | eSSR ↑ |
| ZA | 0.00 | 1.15 ± 0.40 | 1.40 ± 0.31 | 0.40 | 0.00 | 1.16 ± 0.21 | 10.16 ± 1.76 | 0.00 | 0.96 | 0.00 ± 0.00 | 18.04 ± 10.05 | 1.00 | 0.02 | 0.07 ± 0.02 | 67.27 ± 18.94 | 0.20 | 0.96 | 0.00 ± 0.00 | 14.08 ± 6.91 | 1.00 |
| ZB | 0.00 | 3.37 ± 0.58 | 1.37 ± 0.36 | 0.00 | 0.00 | 2.78 ± 0.13 | 6.15 ± 1.92 | 0.00 | 0.90 | 0.77 ± 0.70 | 39.16 ± 9.89 | 0.20 | 0.40 | 0.18 ± 0.13 | 99.79 ± 12.04 | 0.60 | 0.48 | 1.82 ± 0.31 | 37.09 ± 18.20 | 0.20 |
| ZC | 0.00 | 1.68 ± 1.33 | 1.36 ± 0.32 | 0.00 | 0.00 | 3.12 ± 0.80 | 4.88 ± 1.00 | 0.00 | 1.00 | 0.00 ± 0.00 | 10.94 ± 5.95 | 1.00 | 0.02 | 0.22 ± 0.09 | 105.30 ± 3.58 | 0.20 | 1.00 | 1.23 ± 0.16 | 14.23 ± 7.98 | 1.00 |
| ZD | 0.00 | 0.45 ± 0.31 | 1.35 ± 0.33 | 0.00 | 0.00 | 0.56 ± 0.06 | 10.77 ± 12.89 | 0.00 | 0.86 | 0.08 ± 0.02 | 10.14 ± 4.19 | 0.40 | 0.24 | 0.07 ± 0.03 | 39.45 ± 7.07 | 0.60 | 0.98 | 0.00 ± 0.00 | 11.34 ± 6.95 | 0.60 |
pSSR and eSSR are success fractions, not percentages. pSSR evaluates returned planning candidates; eSSR evaluates one selected, adapted execution per seed, including failed planning attempts.
Experimental protocol and metric definitions
Five seeds, with ten clean trajectories per seed. pV and pT are mean ± population standard deviation over the five seed-level values.
The main comparison uses a 48 GB NVIDIA RTX A6000 and nine CPU cores. Planning time covers the complete multi-candidate solve and excludes later execution screening, margin calibration, and deployment.
Nominal sampling/update budgets: 512 samples for stepping stones, 1024 for corridors, and 100 optimizer or reverse steps. These counts do not imply equal wall-clock cost.
pV is sampled obstacle-band occupancy (%), distinct from the body-proxy clearance test used by pSSR.
eSSR measures the reported selection-and-adaptation pipelines, including their differences. Humanoid 2GO additionally uses simulated execution screening and clearance-margin calibration.
Execution requires reaching the fixed task goal within 0.20 m, no fall, and nonnegative modeled body-proxy clearance. Real-world G1 AR demonstrations are qualitative and are not included in this simulation table.
Scope & trade-offs
Performance depends on the task: in the U-shaped corridor, 2GO achieves 48% pSSR versus 90% for MDOC. The progression across these papers does not imply uniform dominance.
Planning and governed execution use different evaluation criteria. Candidate selection and controller adaptation can change outcomes; execution percentages should not be read as planner-only effects.
The real G1 video demonstrates navigation relative to AR obstacles. It does not establish a real-world success rate against physical walls.
Figures and tables reproduce the manuscript's reported experiments. Demonstrations are representative runs; experimental populations and metrics are specified with each table.