The question
Can we generate dynamically feasible, collision-free motion without demonstration training, and use that planner to coordinate a team of robots?
Demonstrations
Source excerpt rescaled to 6.0 seconds; looped, silent; not real-time execution or latency evidence.
Source excerpt rescaled to 6.0 seconds; looped, silent; not real-time execution or latency evidence.
How it works
Let the model guide generation
Instead of querying a learned score network, MDOC samples control sequences, rolls them through known dynamics, and evaluates their costs. Monte Carlo Score Ascent estimates a direction that progressively refines the trajectory distribution toward useful solutions.
Correct controls inside the rollout
A Control Barrier Function defines local safety conditions. At each rollout step, MDOC projects a proposed control onto the corresponding constraint half-spaces before advancing the dynamics. Safety correction therefore acts on the inputs that generate the motion.
Coordinate through conflict resolution
MDOC-CBS separates individual planning from team coordination. Conflict-Based Search identifies inter-robot collisions and adds constraints; affected robots replan with MDOC. The same projection mechanism handles obstacle and inter-robot constraints.
Results
Paper results compare MDOC with single-robot planners and evaluate MDOC-CBS on multi-robot coordination and larger maps.
Reported on larger maps, including the 6 × 6 benchmark; the standard 2 × 2 experiments evaluate up to 20 robots.
Relative to MMD-CBS in the reported 2 × 2 Empty and Conveyor experiments, at comparable conflict-tree expansion levels.
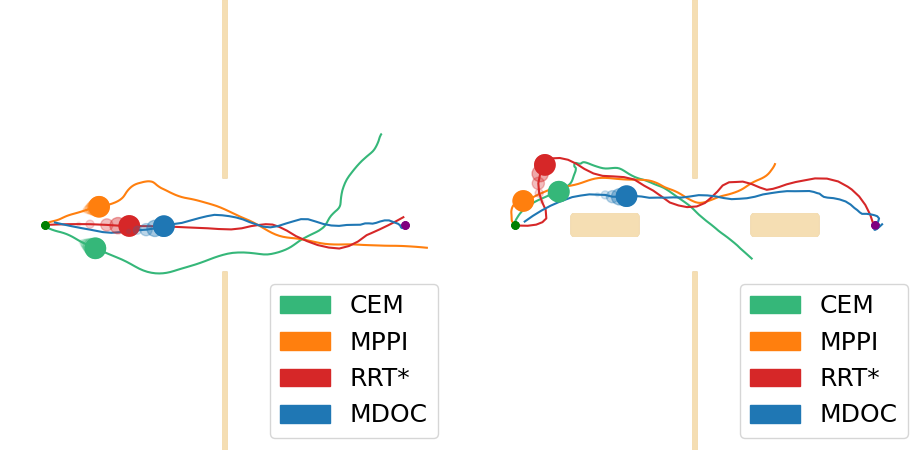
Single-robot narrow passages
Full resolution ↗Best collision-free trajectories from CEM, MPPI, RRT*, and MDOC on the Narrow (left) and More-Constrained Narrow (right) maps. These are the path-comparison panels from the paper; planner colors and legends are unchanged.
Figure 2 (path-comparison panels) · Paper ↗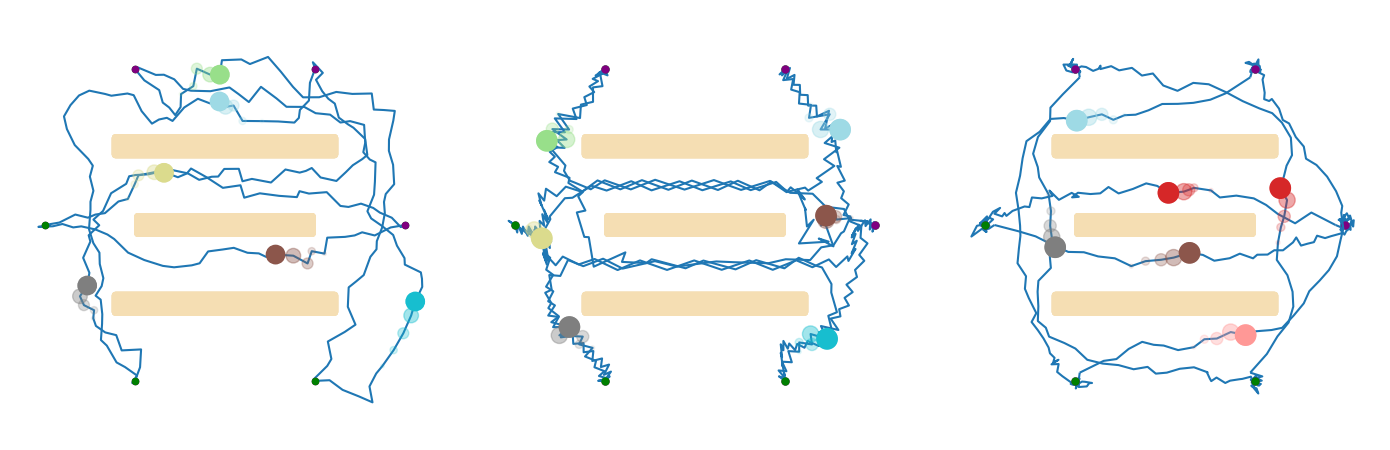
Multi-robot coordination
Full resolution ↗Six robots in the Conveyor Circle setup: KCBS (left), MMD-CBS (center), and MDOC-CBS (right). Trajectories are shown without post-smoothing.
Figure 3 (Conveyor panels) · Paper ↗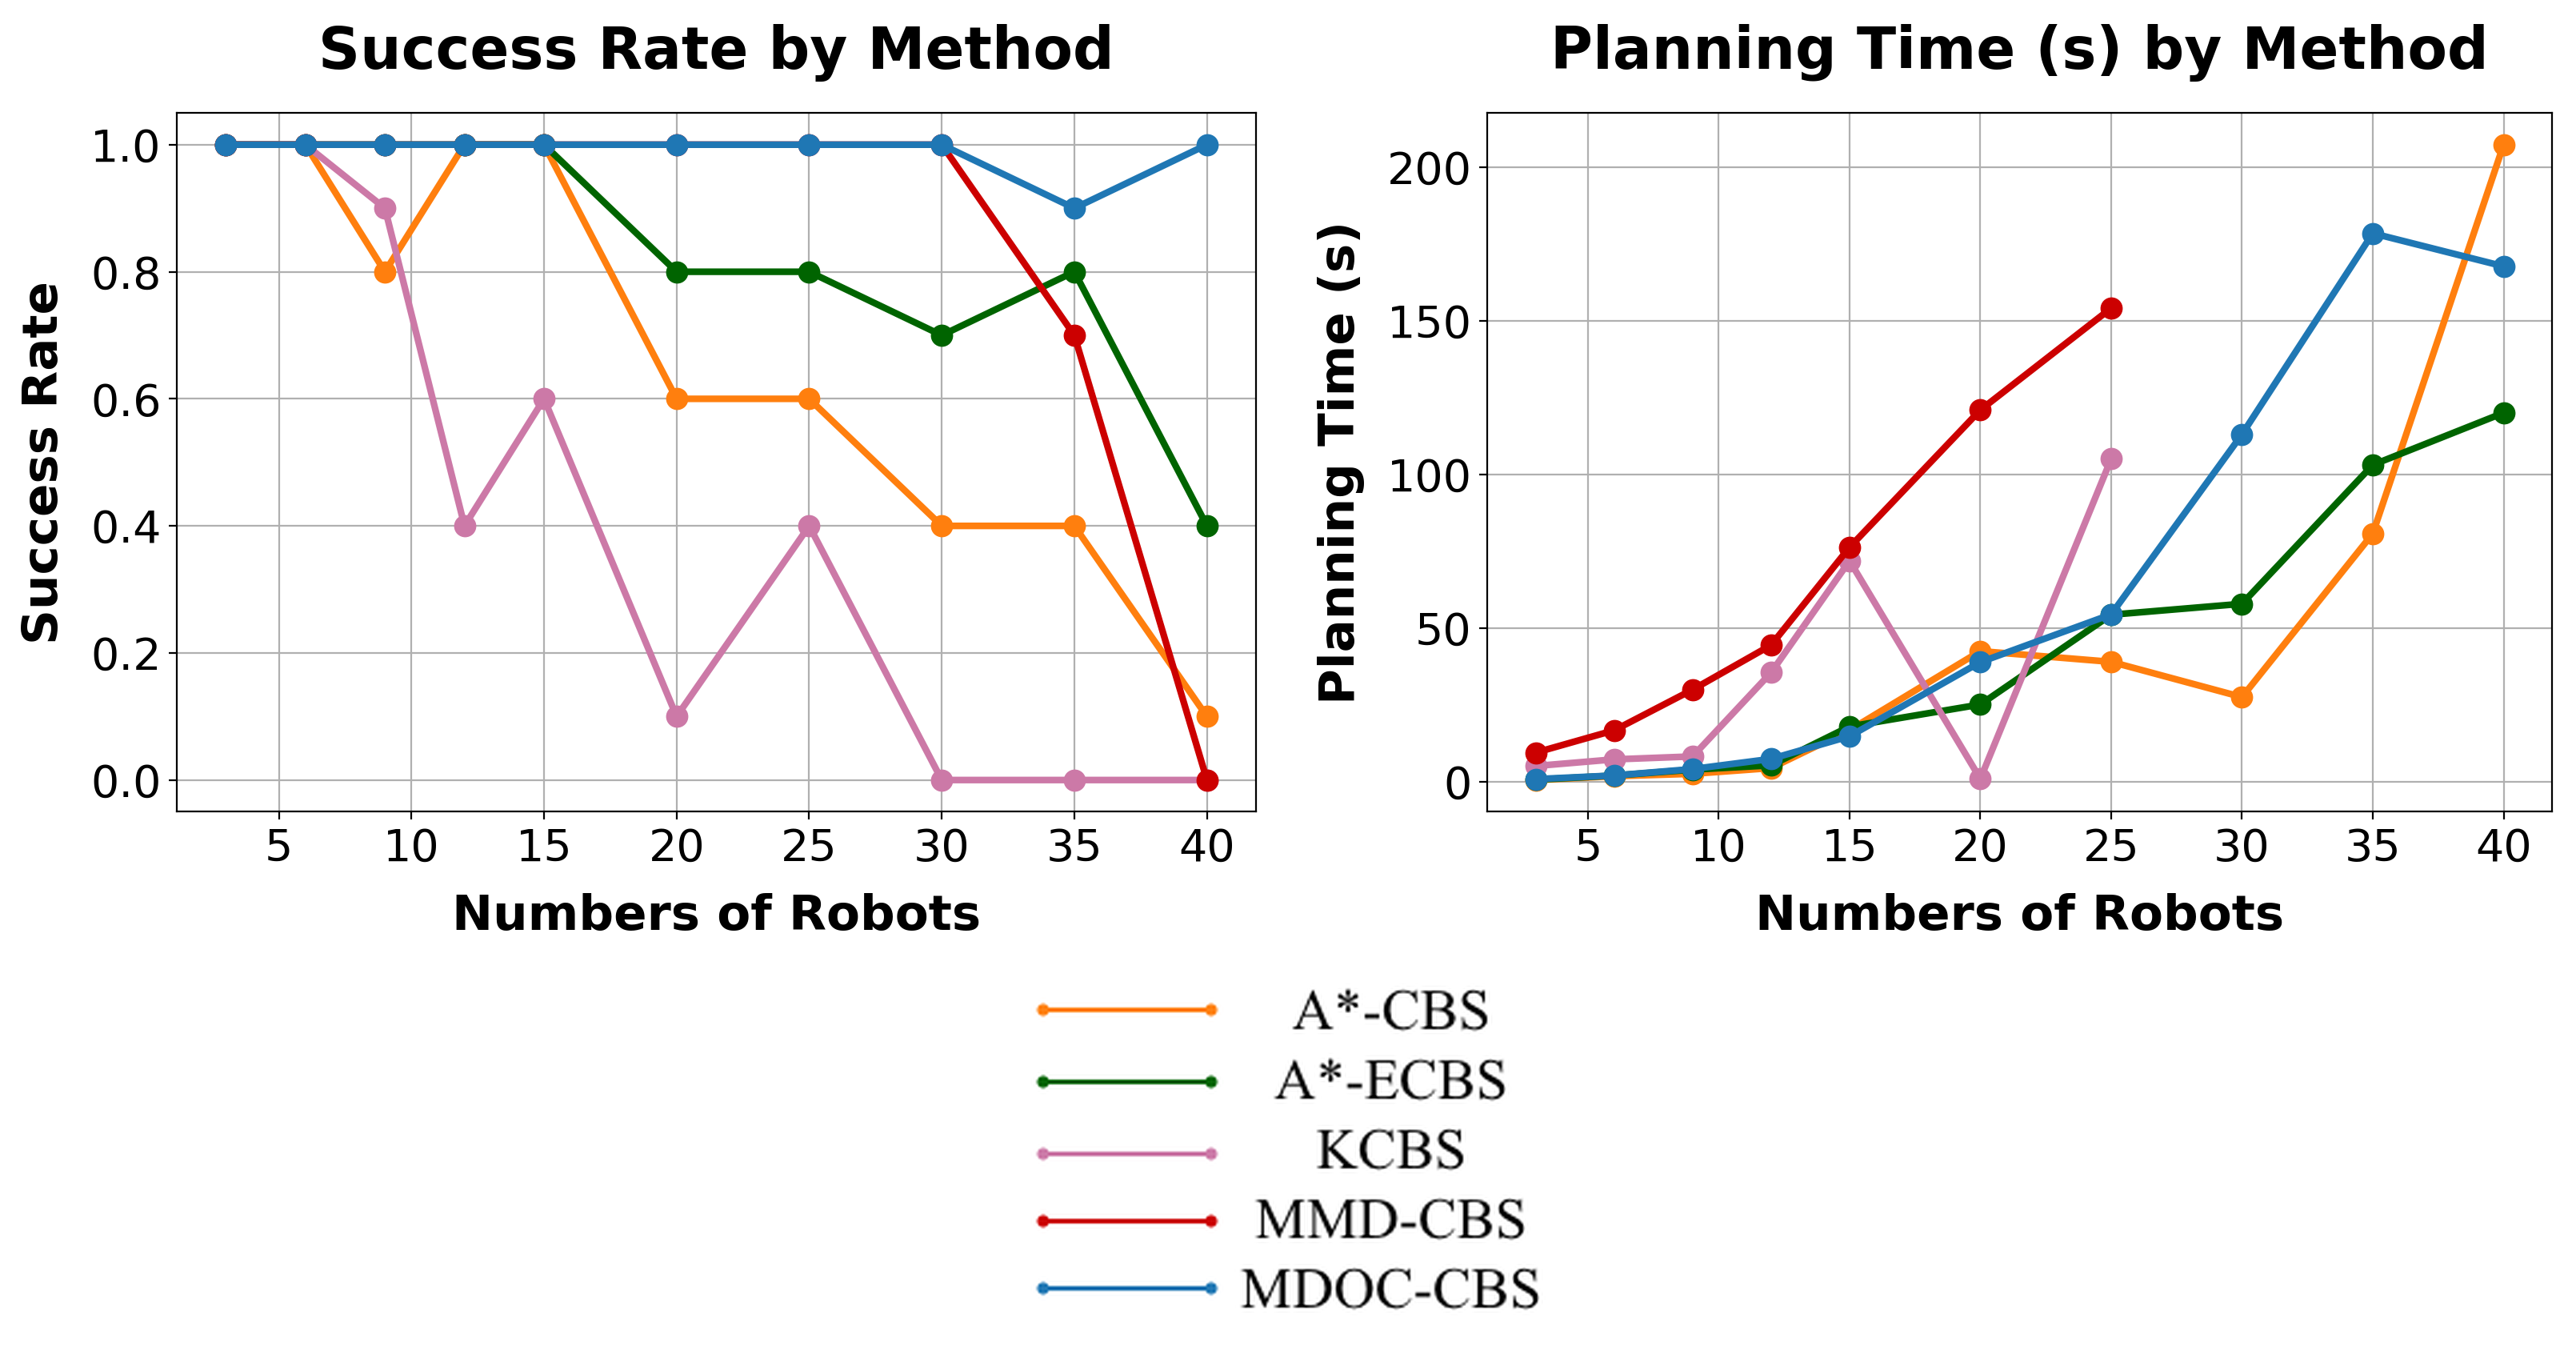
Scaling to 40 robots
Full resolution ↗Success rate and planning time on the 6 × 6 Empty map with the Random setup and horizon H = 196. Ten seeded trials per method and map; each trial has a 500-second limit. Planning time is averaged over successful trials, with outliers included in the mean but omitted beyond the 95th percentile from the visualization.
Figure 6 (6 × 6 results) · Paper ↗Useful samples through narrow passages
Pass & Free Yield (% ↑): candidate trajectories that both traverse the bottleneck and remain collision-free, under a fixed proposal budget of M = 128 per planning step.
| Map | CEM | MPPI | RRT* | MDOC (ours) |
|---|---|---|---|---|
| Narrow | 2.1 ± 0.2 | 3.2 ± 0.3 | 66.1 ± 6.0 | 100.0 |
| More-Constrained Narrow | 0.2 ± 0.1 | 0.4 ± 0.1 | 41.7 ± 3.4 | 100.0 |
Ten trials per method and map, with different random seeds. Hardware: NVIDIA RTX A4500 (20 GB) and 12 CPU cores.
Experimental protocol and metric definitions
For RRT*, Pass & Free Yield is the fraction of expanded nodes whose associated paths traverse the bottleneck and remain collision-free; for trajectory optimizers it is the fraction of candidate trajectories.
Values and uncertainty are reproduced at the precision reported in the paper. The source caption does not identify the type of the ± uncertainty.
Scope & trade-offs
Success is not universal: tight random maps expose Monte Carlo variance and a trade-off between exploration and aggressive CBF correction.
The paper's demonstrated multi-robot scale depends on map, horizon, dynamics, and computational budget; it is not a general deployment guarantee.
Online receding-horizon use, richer dynamics, and improved projection efficiency are identified as future directions.
Citation
@article{he2026model,
  title={Model-Based Diffusion Optimal Control for Multi-Robot Motion Planning},
  author={He, Zhilin and Shaoul, Yorai and Li, Jiaoyang},
  journal={arXiv preprint arXiv:2607.12423},
  year={2026}
}
Figures and tables reproduce the manuscript's reported experiments. Demonstrations are representative runs; experimental populations and metrics are specified with each table.