The question
How can learned interaction strategies be reassessed and corrected when current contact conditions differ from training or nominal predictions?
Demonstrations
Source excerpt rescaled to 6.0 seconds; looped, silent; not real-time execution or latency evidence.
Source excerpt rescaled to 6.0 seconds; looped, silent; not real-time execution or latency evidence.
How it works
Propose useful behaviors
Pretrained RL policies generate structured short-horizon proposals alongside Gaussian exploration. Depending on the integration mode, learned horizons join the refinement bank or compete separately at execution selection.
Reassess with dynamics
Common closed-loop model rollouts evaluate candidates under current conditions. Rollout weighting forms an update without a learned density or score; a favorable candidate is not automatically committed to execution.
Refine for realization
Where enabled, tracking and contact feedback adjust the task references used to define local residuals. Geometry shapes the update, and response reliability modulates refinement strength.
Correct residuals and replan
Local Residual Correction (LRC) applies a damped Jacobian step to residuals left after directional shaping and finite updates. The controller executes the first primitive and shifts the remaining horizon for the next solve.
Results
The paper studies executed contact-rich behavior across surface scanning, peg insertion, and fixed-stance humanoid interaction. The original results retain both successful and failed conditions, separate safe completion from raw completion, and evaluate the learned proposal prior through controlled simulation ablations.
Ten seeds each for nominal, pose-shift, and sensing-shift conditions. MGA: 28 safe completions; PegasusFlow: 23; MPPI and DIAL: 17 each. All 30 MGA trials complete insertion, but two pose-shift trials exceed force limits.
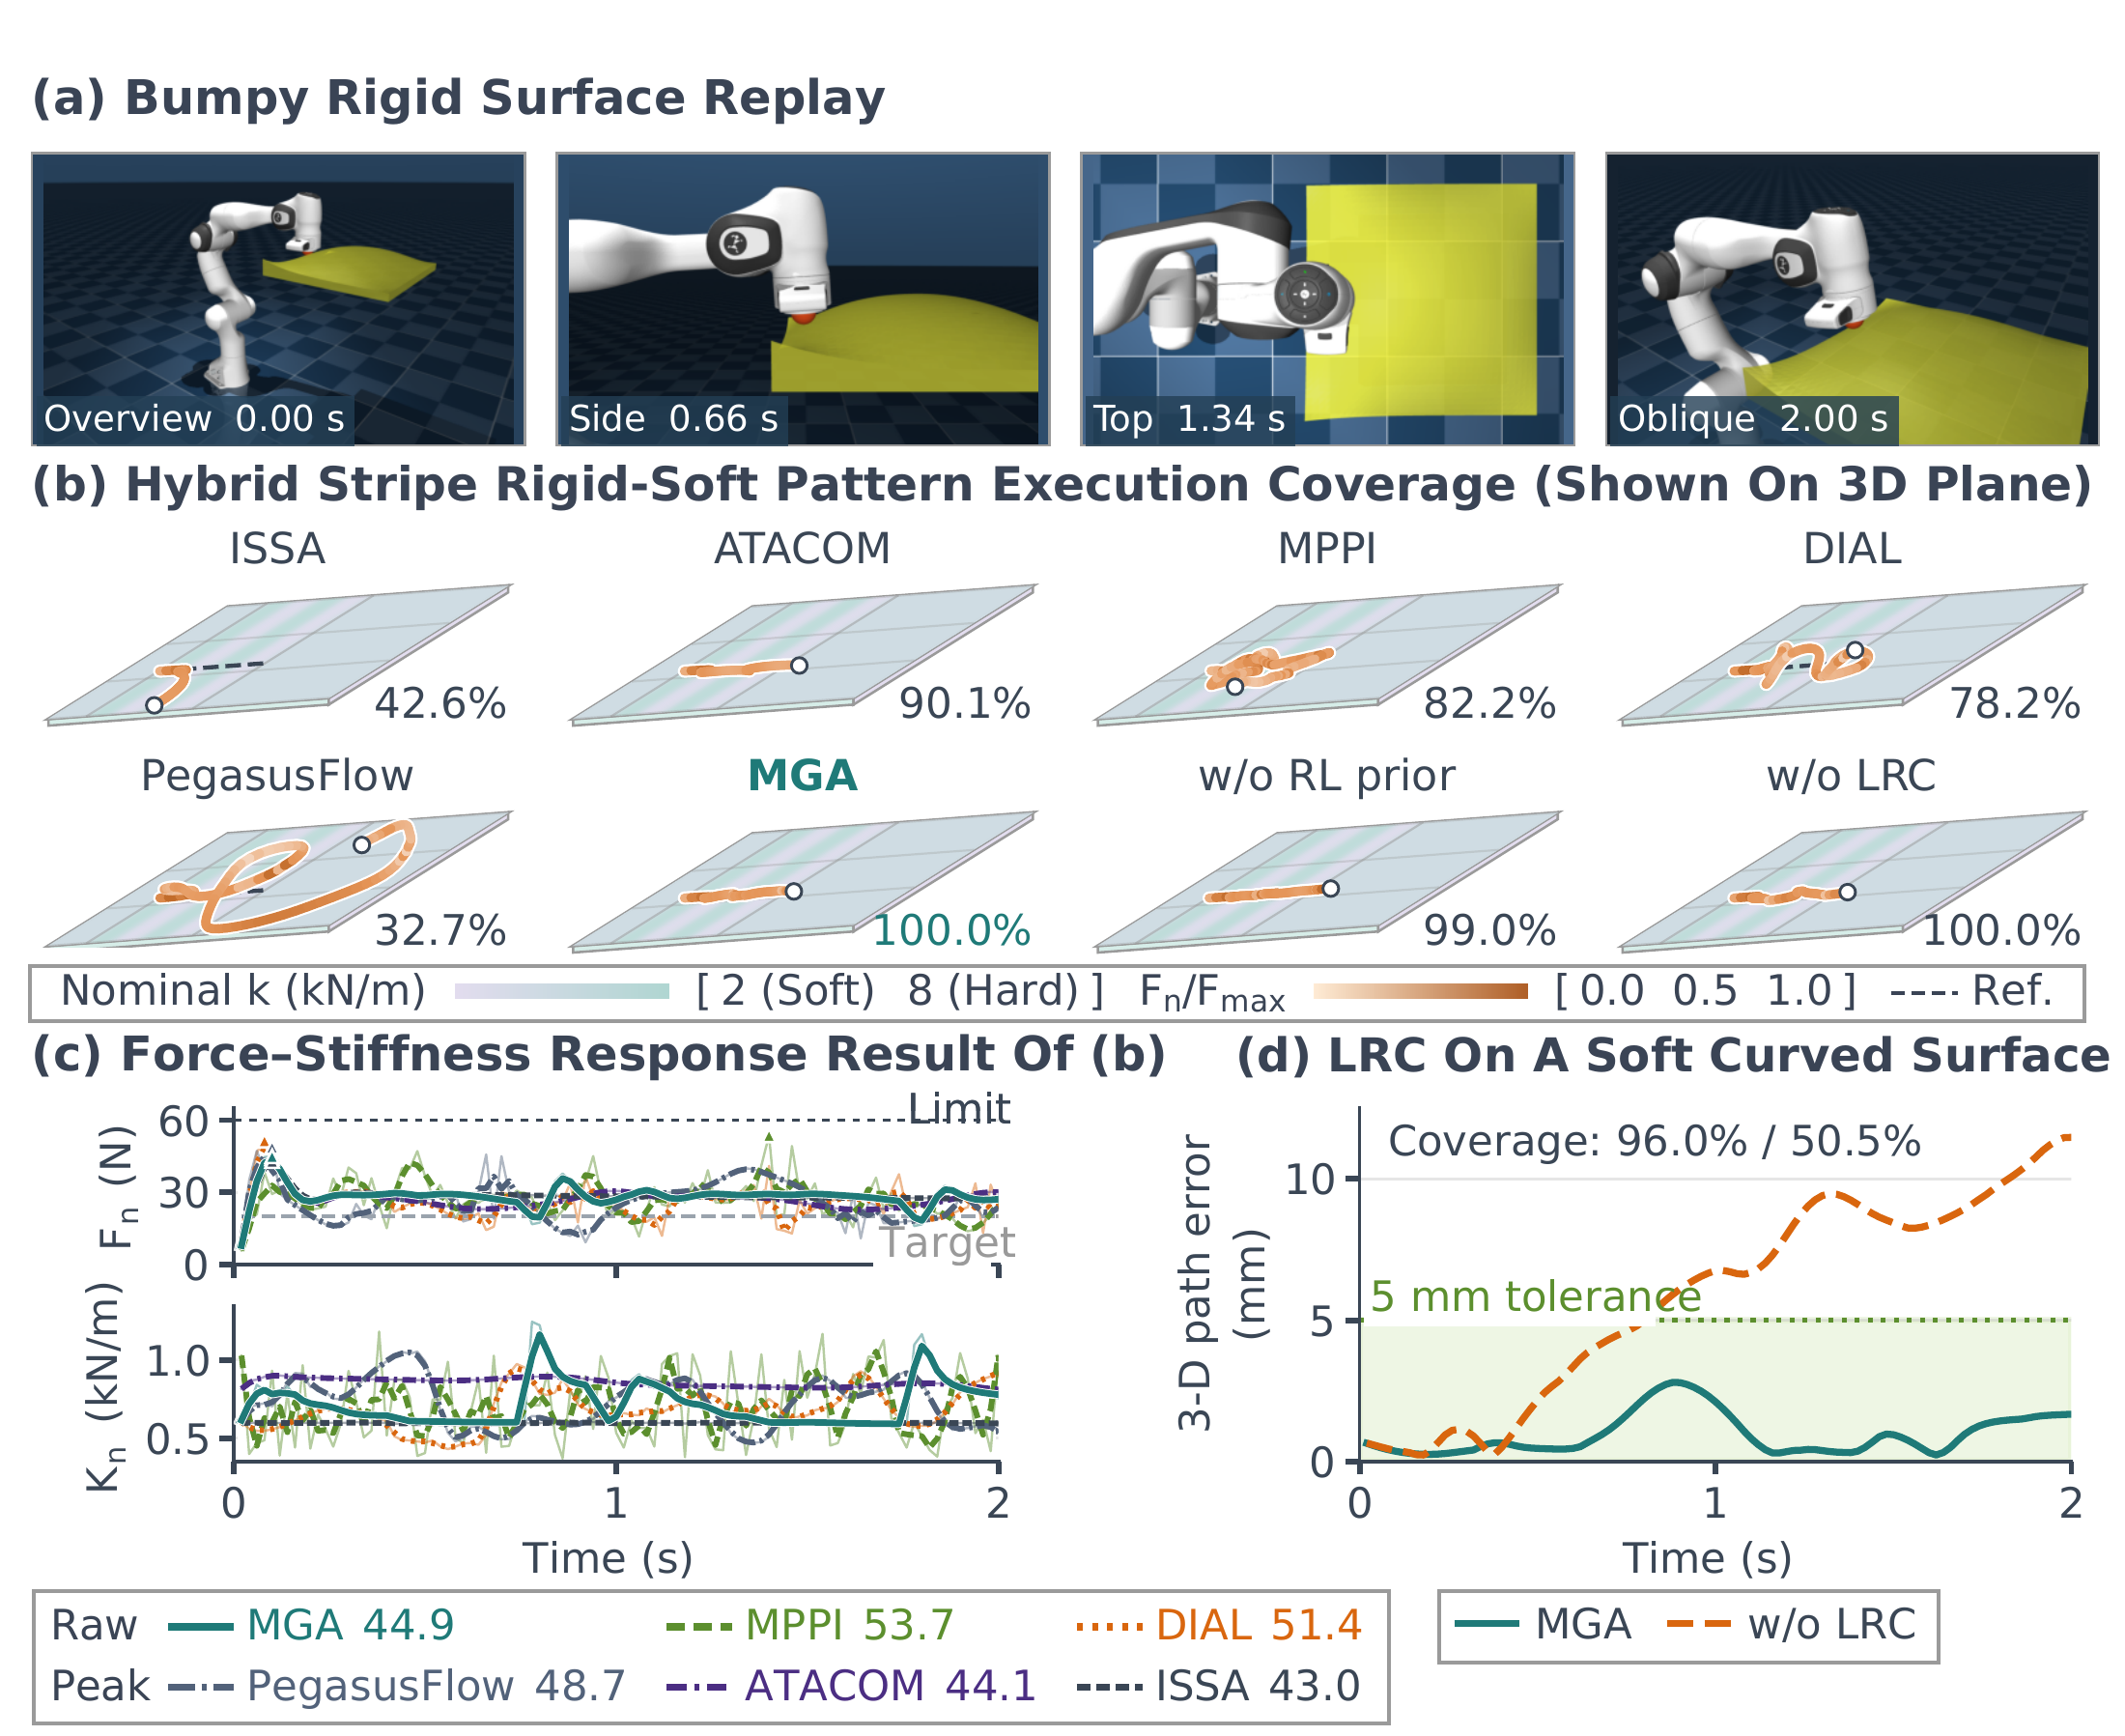
Matched Soft Convex execution: MGA versus the ablation without LRC. The ablation leaves the 5 mm path tolerance. This illustrates the mechanism in one matched case, not an aggregate success rate.
Progress must remain contact-valid
Full resolution ↗Hybrid contact coverage, force–stiffness response, and local residual correction (LRC). In the matched curved-soft-surface execution, MGA covers 96.0% of the path versus 50.5% without LRC while remaining within the 5 mm path tolerance. These panels show representative simulated executions; the table aggregates seeds.
Figure 3 · panels a–d · Paper ↗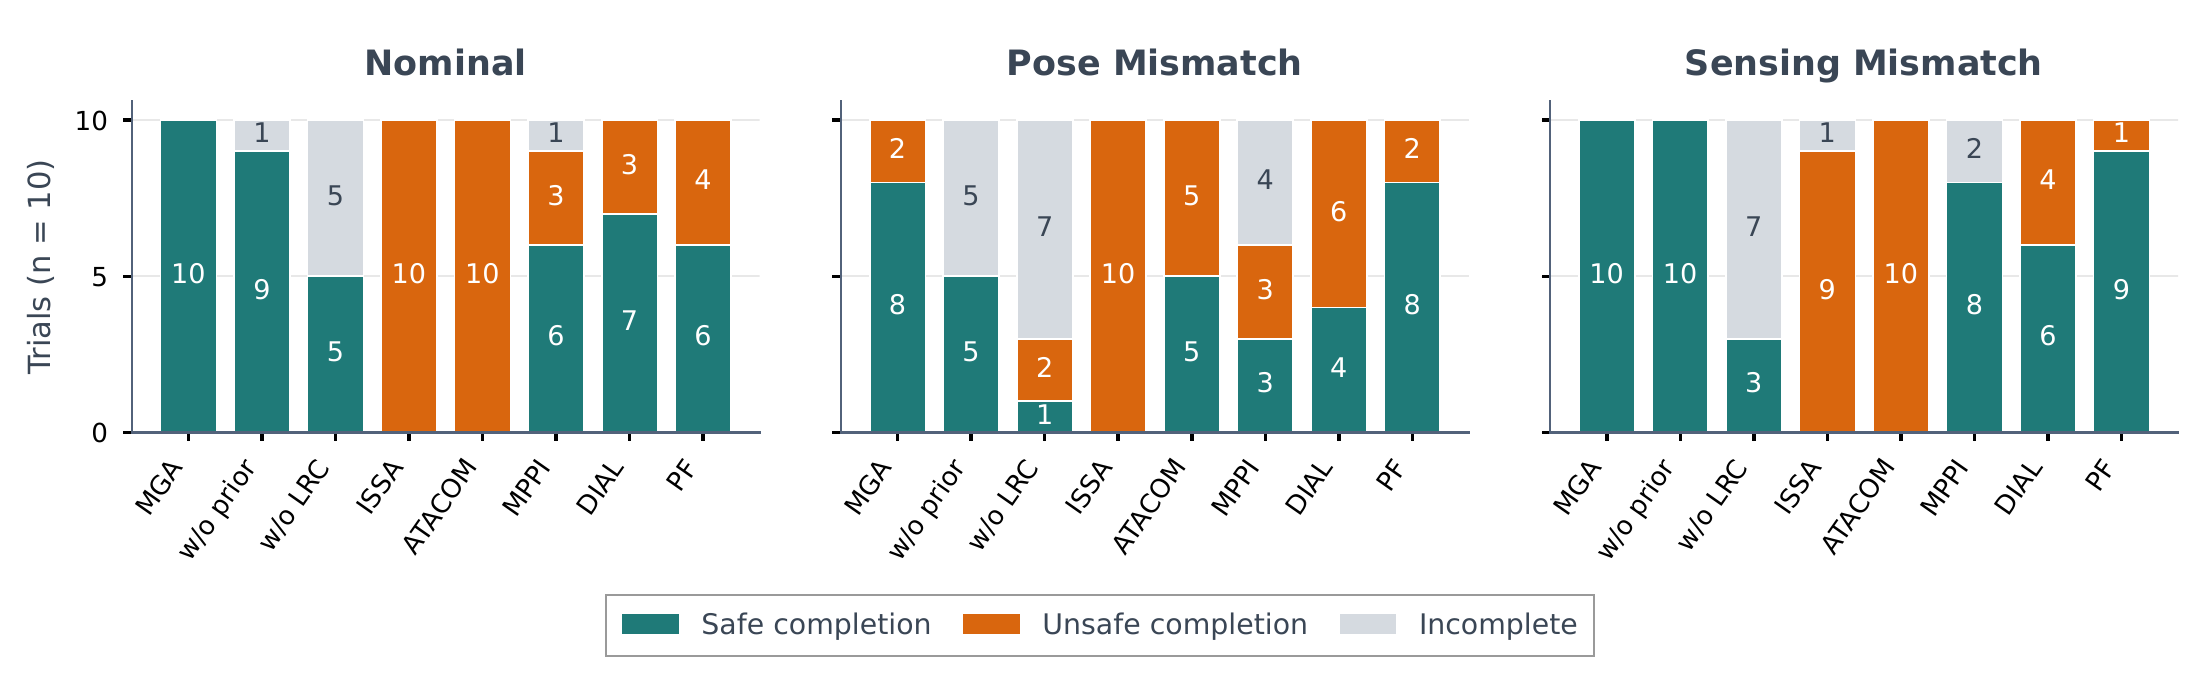
Safe completion is a separate outcome
Full resolution ↗All ten seeds per method and insertion condition are retained. Across ID, Pose-OOD, and Sensing-OOD, MGA completes 28 of 30 trials safely; the two unsafe completions occur under pose mismatch. The plot distinguishes safe completion, completion with a wrench violation or jam, and incomplete insertion.
Figure 10 · appendix · Paper ↗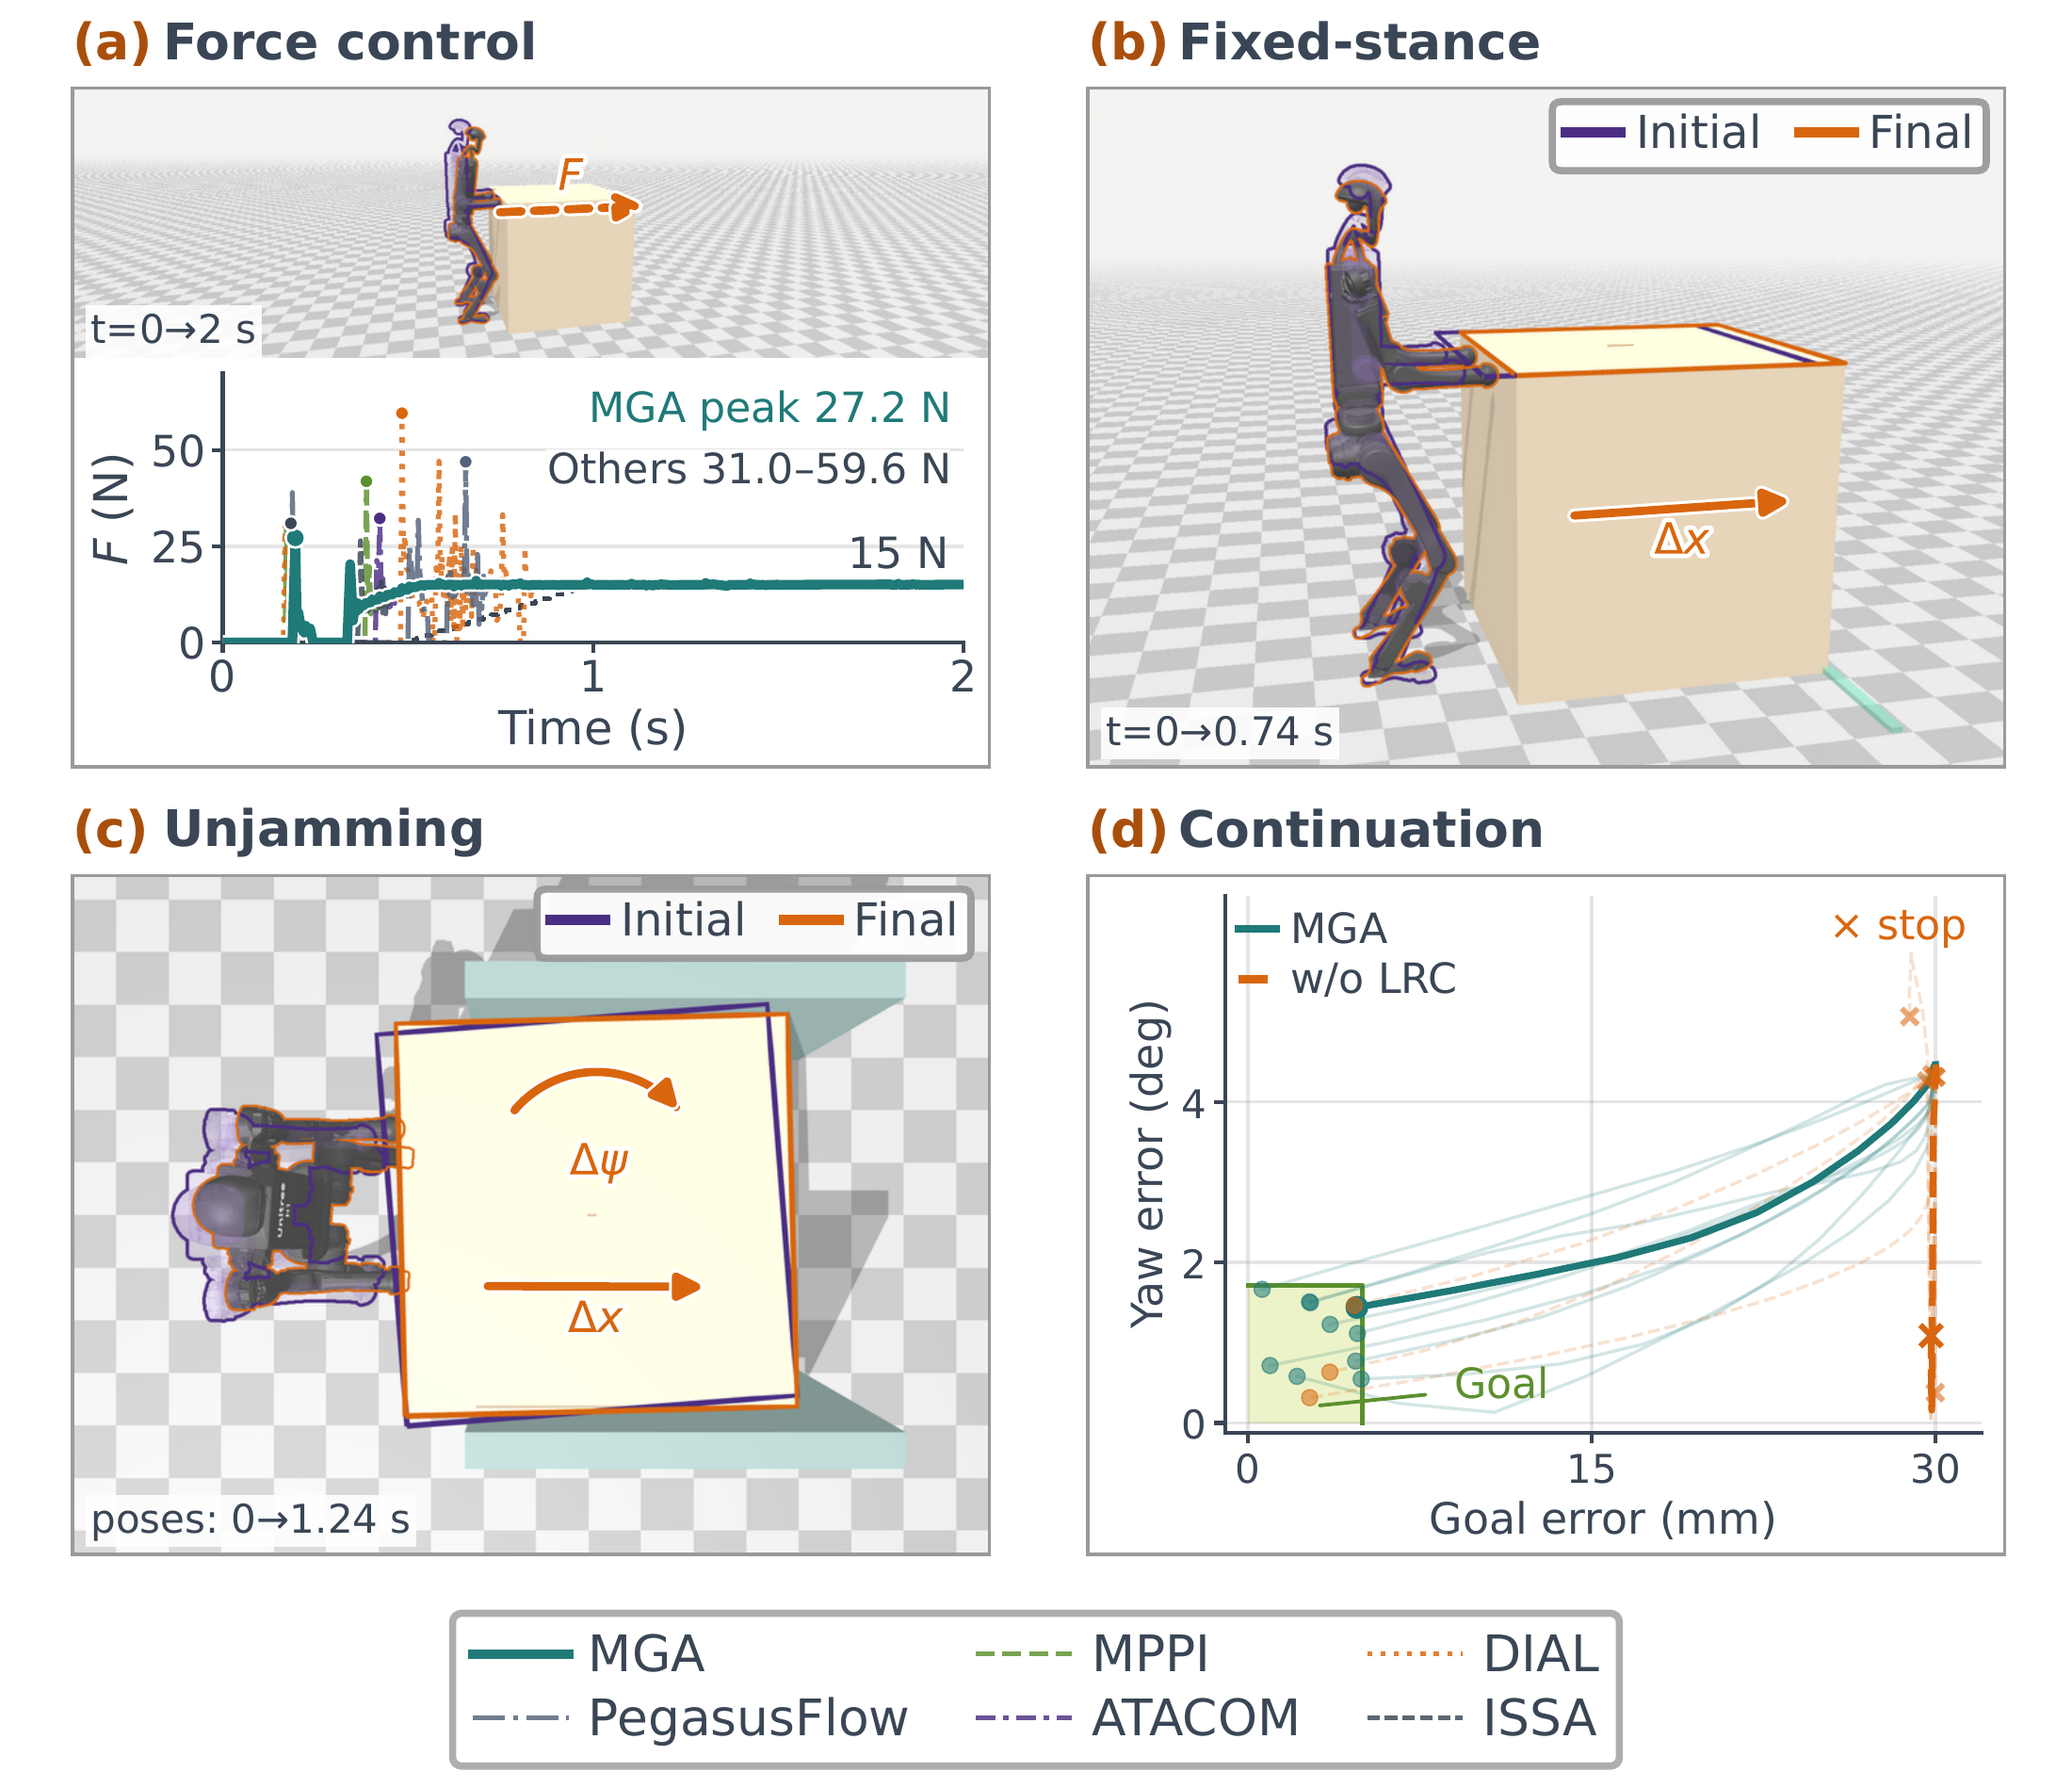
Balance, contact, and object motion together
Full resolution ↗Simulated force regulation, fixed-stance pushing, and unjamming. The ten paired position–yaw trajectories expose continued interaction: MGA safely completes 10/10 unjamming trials, versus 3/10 without LRC. Crosses mark safety-triggered stops. Walking pushes are outside this reported comparison.
Figure 4 · Paper ↗Contact-rich simulation benchmarks
Complete main-results table: safe-success rate S (%) and normalized contact-load tail risk F (nCVaR95) across three contact-rich tasks.
| Task | Condition | Metric | ISSA | ATACOM | MPPI | DIAL | PegasusFlow | MGA (ours) | w/o RL prior | w/o LRC |
|---|---|---|---|---|---|---|---|---|---|---|
| Surface scanning | Hard | S (%) ↑ | 5.0 ± 10.0 | 25.0 ± 0.0 | 22.5 ± 20.8 | 62.5 ± 20.2 | 5.0 ± 10.0 | 100.0 ± 0.0 | 100.0 ± 0.0 | 67.5 ± 19.5 |
| Surface scanning | Hard | F (nCVaR95) ↓ | 0.596 ± 0.050 | 0.533 ± 0.015 | 1.029 ± 0.094 | 0.848 ± 0.122 | 1.301 ± 0.237 | 0.498 ± 0.037 | 0.486 ± 0.017 | 0.521 ± 0.039 |
| Surface scanning | Soft | S (%) ↑ | 2.5 ± 7.5 | 50.0 ± 0.0 | 20.0 ± 15.0 | 77.5 ± 17.5 | 30.0 ± 24.5 | 100.0 ± 0.0 | 100.0 ± 0.0 | 70.0 ± 15.0 |
| Surface scanning | Soft | F (nCVaR95) ↓ | 0.596 ± 0.051 | 0.470 ± 0.011 | 0.973 ± 0.059 | 0.762 ± 0.098 | 1.094 ± 0.202 | 0.466 ± 0.024 | 0.488 ± 0.031 | 0.498 ± 0.017 |
| Surface scanning | Hybrid | S (%) ↑ | 0.0 ± 0.0 | 66.7 ± 0.0 | 30.0 ± 10.0 | 56.7 ± 21.3 | 20.0 ± 16.3 | 100.0 ± 0.0 | 96.7 ± 10.0 | 56.7 ± 21.3 |
| Surface scanning | Hybrid | F (nCVaR95) ↓ | 0.698 ± 0.037 | 0.606 ± 0.000 | 0.879 ± 0.034 | 0.789 ± 0.031 | 0.862 ± 0.032 | 0.658 ± 0.016 | 0.738 ± 0.016 | 0.702 ± 0.020 |
| Surface scanning | Unseen | S (%) ↑ | 0.0 ± 0.0 | 50.0 ± 0.0 | 45.0 ± 26.9 | 65.0 ± 32.0 | 15.0 ± 22.9 | 50.0 ± 0.0 | 55.0 ± 15.0 | 75.0 ± 25.0 |
| Surface scanning | Unseen | F (nCVaR95) ↓ | 0.555 ± 0.025 | 0.417 ± 0.016 | 0.827 ± 0.067 | 0.754 ± 0.149 | 1.018 ± 0.353 | 0.429 ± 0.023 | 0.433 ± 0.018 | 0.502 ± 0.030 |
| Peg insertion | ID | S (%) ↑ | 0.0 ± 0.0 | 0.0 ± 0.0 | 60.0 ± 49.0 | 70.0 ± 45.8 | 60.0 ± 49.0 | 100.0 ± 0.0 | 90.0 ± 30.0 | 50.0 ± 50.0 |
| Peg insertion | ID | F (nCVaR95) ↓ | 0.723 ± 0.102 | 1.079 ± 0.000 | 0.162 ± 0.221 | 0.620 ± 0.186 | 0.670 ± 0.141 | 0.775 ± 0.010 | 0.733 ± 0.093 | 0.449 ± 0.289 |
| Peg insertion | Pose-OOD | S (%) ↑ | 0.0 ± 0.0 | 50.0 ± 50.0 | 30.0 ± 45.8 | 40.0 ± 49.0 | 80.0 ± 40.0 | 80.0 ± 40.0 | 50.0 ± 50.0 | 10.0 ± 30.0 |
| Peg insertion | Pose-OOD | F (nCVaR95) ↓ | 1.203 ± 0.347 | 0.916 ± 0.053 | 0.366 ± 0.248 | 0.740 ± 0.221 | 0.630 ± 0.227 | 0.893 ± 0.093 | 0.769 ± 0.156 | 0.477 ± 0.365 |
| Peg insertion | Sensing-OOD | S (%) ↑ | 0.0 ± 0.0 | 0.0 ± 0.0 | 80.0 ± 40.0 | 60.0 ± 49.0 | 90.0 ± 30.0 | 100.0 ± 0.0 | 100.0 ± 0.0 | 30.0 ± 45.8 |
| Peg insertion | Sensing-OOD | F (nCVaR95) ↓ | 0.660 ± 0.053 | 0.969 ± 0.000 | 0.204 ± 0.273 | 0.601 ± 0.228 | 0.667 ± 0.089 | 0.774 ± 0.011 | 0.775 ± 0.041 | 0.435 ± 0.300 |
| Humanoid push | Force regulation | S (%) ↑ | 100.0 ± 0.0 | 100.0 ± 0.0 | 100.0 ± 0.0 | 90.0 ± 30.0 | 70.0 ± 45.8 | 100.0 ± 0.0 | 100.0 ± 0.0 | 90.0 ± 30.0 |
| Humanoid push | Force regulation | F (nCVaR95) ↓ | 0.271 ± 0.000 | 0.270 ± 0.000 | 0.288 ± 0.004 | 0.357 ± 0.028 | 0.335 ± 0.016 | 0.262 ± 0.005 | 0.280 ± 0.000 | 0.263 ± 0.004 |
| Humanoid push | Fixed-stance push | S (%) ↑ | 0.0 ± 0.0 | 0.0 ± 0.0 | 100.0 ± 0.0 | 100.0 ± 0.0 | 100.0 ± 0.0 | 100.0 ± 0.0 | 100.0 ± 0.0 | 100.0 ± 0.0 |
| Humanoid push | Fixed-stance push | F (nCVaR95) ↓ | 0.972 ± 0.000 | 1.057 ± 0.000 | 0.557 ± 0.019 | 0.550 ± 0.022 | 0.559 ± 0.016 | 0.503 ± 0.038 | 0.492 ± 0.005 | 0.538 ± 0.010 |
| Humanoid push | Unjamming | S (%) ↑ | 0.0 ± 0.0 | 0.0 ± 0.0 | 100.0 ± 0.0 | 100.0 ± 0.0 | 100.0 ± 0.0 | 100.0 ± 0.0 | 80.0 ± 40.0 | 30.0 ± 45.8 |
| Humanoid push | Unjamming | F (nCVaR95) ↓ | 1.458 ± 0.159 | 1.601 ± 0.000 | 0.798 ± 0.006 | 0.805 ± 0.008 | 0.807 ± 0.012 | 0.845 ± 0.026 | 0.742 ± 0.005 † | 0.862 ± 0.014 ‡ |
Entries are mean ± standard deviation over ten seeds. Surface-scanning groups contain four Hard, four Soft, three Hybrid, and two Unseen conditions; the groups are disjoint.
Experimental protocol and metric definitions
S uses task-specific safe-success criteria. Scanning requires at least 90% contact-valid coverage within 5 mm, at most 10% settled contact loss, and permits at most one of 100 force samples to exceed 60 N.
Peg-insertion safe success requires a complete 64-step execution without any wrench violation or jam, including after first completion. ID is nominal; Pose-OOD perturbs socket pose; Sensing-OOD biases wrench observations. Safety uses true simulated loads.
F is dimensionless normalized load-tail risk. Scanning and humanoid force are normalized by a 60 N limit; peg insertion uses the maximum normalized axial/lateral force and bending/torsional torque utilization. Lower loads alone do not imply completion.
† and ‡: Unjamming tails without the prior and without LRC are conditional on eight and three accepted runs, respectively; rejected prefixes count as failures. These tails are not ranked against the ten-run MGA estimate.
The prior is evaluated additively in peg insertion and the reported humanoid runs: one deterministic and eight stochastic learned horizons compete with the refined Gaussian sequence. This is not an equal-total-rollout-cost comparison with the no-prior ablation.
Humanoid results cover 15 N force regulation, a nominal 8 kg box pushed 0.10 m from fixed stance, and 0.03 m unjamming with yaw correction. Walking pushes and randomized pushing conditions are not in this comparison.
These are results of the paper protocol, separate from V1 GPU qualification and robot-controller deployment support.
Repeated surface scanning on physical hardware
Original repeated-trial force measurements from a 6-DoF Dobot Nova 5 with wrist force/torque sensing. The hardware experiment evaluates the model-based component without a learned proposal prior.
| Surface | Reference force (N) | Mean force (N) | MAE (N) | RMSE (N) |
|---|---|---|---|---|
| Table | 3.0 | 2.987 ± 0.014 | 0.391 ± 0.054 | 0.506 ± 0.094 |
| Foam | 0.8 | 0.817 ± 0.017 | 0.176 ± 0.006 | 0.222 ± 0.012 |
| Phantom | 3.0 | 2.940 ± 0.064 | 0.378 ± 0.013 | 0.454 ± 0.015 |
Mean ± sample standard deviation over five trials per surface. Statistics use unsmoothed, gravity-compensated and tared feedback with physical timestamps, including holds and recovery intervals during scanning.
Experimental protocol and metric definitions
All 15 scans reach their path endpoint. Complete-session outcomes are 5/5 for table, 4/5 for foam, and 5/5 for phantom; one foam session stops because robot feedback becomes stale after scanning and release.
The force calibration has a held-out 95th-percentile residual of 1.14 N. These metrics characterize compensated feedback rather than independently verified absolute contact force.
The hardware protocol uses a 0.4 s horizon, 48 candidate sequences, nominal 10 Hz planning and 20 Hz position commands, with bounded normal-force feedback. Results reflect the planner and feedback controller together.
Scope & trade-offs
LRC is a local correction, not an exact projection or hard-feasibility guarantee. Unseen-surface safe success is 50%; the 100% results for nominal hard, soft, and hybrid groups should not be generalized to unseen surfaces.
Peg and humanoid evaluations add nine learned horizons per replanning call after Gaussian refinement. These experts compete separately and do not receive that refinement. The 64-sample nominal budget does not imply equal total rollout cost.
Hardware results validate the model-based component with contact feedback, not the complete RL-assisted simulation configuration.
Figures and tables reproduce the manuscript's reported experiments. Demonstrations are representative runs; experimental populations and metrics are specified with each table.